Opinion
Beyond Borders: Why Population Density, Not Country Size, Defines Africa’s Real Markets


By John Kourkoutas
A cartographic revelation exposes the fundamental flaw in how businesses approach the continent’s 1.4 billion consumers.
For decades, multinational corporations and investors have made the same systematic error when evaluating African markets: they have confused population size with market accessibility. A striking cartographic analysis that divides Africa into regions of equal population – precisely 1.5 million people each – reveals why this approach has led to countless strategic miscalculations and why density, not demographic totals, should dictate market entry decisions.
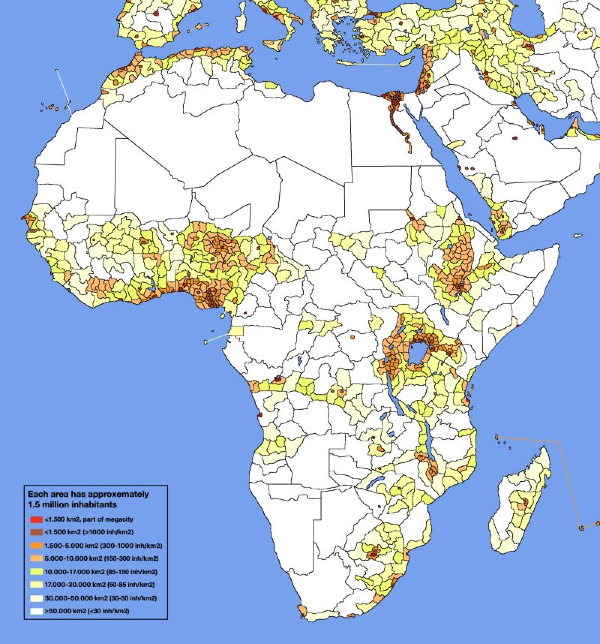
The map in question color-codes these equal-population zones by area, creating a visual hierarchy from dark red (megacity-dense clusters occupying less than 1,500 square kilometers) to pale yellow (sparse populations spread across more than 50,000 square kilometers). The result challenges every conventional assumption about African commerce.
The Density Imperative
Consider two nations with nearly identical populations: Tanzania, with 65 million people, and South Africa, with 60 million. On a spreadsheet, they appear roughly equivalent markets.
The density map tells a radically different story. Tanzania’s population sprawls across pale yellow zones – diluted, dispersed, and extraordinarily expensive to serve. South Africa’s consumers concentrate in red and orange clusters around Johannesburg, Cape Town, and Durban.
Same population. Infinitely different distribution economics.
This distinction explains why South Africa generates nearly ten times Tanzania’s retail revenue per capita, despite comparable population figures. Distribution costs devour margins when customers are scattered; they enhance them when concentrated.

Population Density, Not Country Size, Defines Africa’s Real Markets
The Lagos Phenomenon
Nigeria’s commercial capital appears as the darkest red zone in sub-Saharan Africa on the density map – more than 15 million people compressed into an area smaller than metropolitan Athens. This represents the highest consumer concentration per square kilometer on the continent south of Cairo, and it explains why Lagos serves as the default entry point for consumer brands targeting African markets.
The Lagos gravity well extends beyond its official boundaries. The broader Nigerian coastal corridor from Lagos through Ibadan to Port Harcourt concentrates over 40 million consumers in a relatively compact orange-to-red zone. Meanwhile, Nigeria’s northern interior fades to pale yellow – nominally part of the same country but functionally a separate market requiring distinct logistics, different products, and substantially higher customer acquisition costs.
The Sahara Distortion
North Africa’s massive countries – Algeria spans 2.4 million square kilometers, Libya 1.8 million – appear imposing on conventional maps. The density analysis reveals them as illusions.
Vast swathes register as empty gray, functionally unpopulated. Algeria’s 45 million people cluster almost entirely along the Mediterranean coast in a narrow orange band.
The interior Sahara, comprising 80 percent of the country’s landmass, barely registers.
This has profound implications for market sizing. Businesses shouldn’t evaluate “the Algerian market” but rather “the Algiers-Oran-Constantine coastal corridor market” – a dramatically smaller, more European-facing opportunity than the country’s geographic footprint suggests.
The East African Corridor Advantage
One of the map’s most illuminating patterns emerges along Africa’s eastern spine: a continuous ribbon of orange and yellow zones stretching from Addis Ababa through Nairobi, Kampala, Kigali, and down to Dar es Salaam. This corridor, home to approximately 250 million people across five countries, presents a compelling case for regional rather than national market strategies.
The density gradient remains relatively consistent throughout this corridor – moderate urban concentration punctuated by dispersed rural populations. A single integrated approach could serve this entire region more efficiently than five separate country strategies, particularly for digital services, telecommunications, and consumer goods with minimal localization requirements.
The Zambia Problem
Zambia illustrates density disadvantage at scale. Twenty million people inhabit 750,000 square kilometers – an area larger than France and the United Kingdom combined.
The entire country registers pale yellow, with no significant urban concentration approaching megacity density. Lusaka, the capital and largest city, contains barely 3 million people spread across a relatively diffuse metropolitan area.
This explains why Zambia remains persistently expensive to serve despite reasonable absolute population numbers and relatively favorable business conditions. Distribution networks must extend vast distances to reach fragmented consumer bases.
Last-mile delivery costs become prohibitive. Marketing spend dilutes across dispersed audiences. The economics simply don’t work until much later in a company’s African expansion trajectory.
Contrast this with Nigeria, where similar investment reaches five times as many consumers in a fraction of the geographic area. The difference isn’t governance or infrastructure – it’s geometry.
The DR Congo Paradox
The Democratic Republic of Congo, with over 100 million inhabitants, ranks among Africa’s largest populations. Yet the density map reveals it as predominantly pale yellow – a vast, sparsely populated interior punctuated by two significant concentrations: Kinshasa in the west and the Kivu provinces bordering Rwanda and Uganda in the east.
This bifurcation creates what might be termed “the DR Congo dilemma.” Kinshasa, with 15 million people, merits attention as a standalone megacity market.
The eastern border region connects naturally to the East African corridor. But the two zones lie 2,000 kilometers (1,243 miles) apart with limited infrastructure connecting them. Treating the DR Congo as a single market makes little strategic sense; treating it as two distinct opportunities aligned with different regional clusters proves far more practical.
Rwanda’s Density Miracle
Rwanda presents the inverse case: a small country that punches dramatically above its weight due to exceptional density. Thirteen million people inhabit just 26,000 square kilometers – roughly 500 people per square kilometer, a ratio approaching European levels.
The entire country displays orange-to-red coloring on the density map.
This explains Rwanda’s outsized presence in African business discourse relative to its population. Distribution costs remain minimal.
Urban and rural consumers live in relatively close proximity. Marketing efficiently reaches national audiences.
Digital infrastructure investments yield high returns per capita. Rwanda isn’t “easier” than larger neighbors because of superior governance alone – though that helps – but because its density fundamentally alters business economics.
Red Zones Equal ROI
The strategic implications crystallize around a simple principle: red and dark orange zones on the density map correlate directly with return on investment potential. Lagos, Nairobi, Johannesburg, Cairo, Dar es Salaam, and Addis Ababa – these six metropolitan concentrations contain over 80 million consumers reachable through efficient, concentrated distribution networks.
A business that dominates these six zones establishes a profitable foundation for African expansion. The economics work: customer acquisition costs remain manageable, logistics expenses stay reasonable, and marketing reaches critical mass.
From this base, expansion into yellow zones becomes feasible, cross-subsidized by profitable urban cores.
The alternative approach – attempting comprehensive coverage across ten pale yellow countries to access 100 million dispersed consumers – typically requires years to reach profitability, if it ever does. The mathematics simply don’t favor dispersed population strategies in markets with Africa’s infrastructure constraints.
Rethinking Market Entry
Fifteen years of African market experience has taught me to reframe fundamental questions. The outdated query – “Should we enter Kenya, Tanzania, Uganda, and Rwanda?” – treats countries as discrete opportunities requiring individual evaluation and separate go-to-market strategies.
The density-informed question becomes: “How do we dominate the East African population corridor from Addis Ababa to Dar es Salaam, focusing first on the red-zone urban concentrations?” This reorientation from political boundaries to density clusters transforms strategic planning.
It means launching in Nairobi and Dar es Salaam simultaneously rather than sequentially, because they are part of the same density corridor. It means treating Kigali as a natural extension of regional operations rather than a separate country market.
It means deprioritizing vast pale-yellow territories regardless of their nominal GDP figures, because the distribution economics remain unworkable.
The Density-First Framework
The path forward for businesses serious about African markets follows clear principles derived from this cartographic analysis:
First, identify red zones. Lagos, Nairobi, Johannesburg, Cairo, Dar es Salaam, Addis Ababa, Accra, Abidjan, Casablanca, and Kigali represent the continent’s highest-density consumer concentrations.
These should anchor any market entry strategy.
Second, connect the corridors. West African coastal cities form a natural cluster.
The East African corridor represents another. Southern African urban centers around Johannesburg constitute a third. Mediterranean North Africa comprises a fourth. Regional strategies connecting these corridors outperform country-by-country expansion.
Third, resist the total population temptation. Large countries with dispersed populations – however appealing their aggregate numbers – should follow, not lead, expansion plans.
Zambia’s 20 million dispersed consumers represent a later-stage opportunity. Rwanda’s 13 million concentrated consumers warrant earlier attention.
Fourth, recognize the 80/20 dynamic. In most African countries, 80 percent of accessible consumer spending concentrates in 20 percent of the geography – usually the capital city and one or two secondary urban centers.
Strategies should reflect this reality rather than aspirations of comprehensive national coverage.
Fifth, let density dictate resource allocation. Marketing budgets, distribution investments, and talent deployment should follow density gradients, not political boundaries or total population figures.
One distribution center serving Lagos reaches more consumers than five centers spanning Zambia.
Beyond the Map
This cartographic revelation ultimately illuminates a broader truth about emerging markets: conventional metrics often obscure more than they reveal. GDP figures, population totals, and country rankings provide comforting simplicity but dangerous oversimplification.
Africa’s consumer opportunity is real and substantial – but it’s not uniformly distributed across 54 countries and 1.4 billion people. It concentrates in specific urban nodes connected by emerging corridors, surrounded by vast territories that will remain commercially marginal for decades regardless of infrastructure investment or governance improvements.
Success requires seeing past the political map to the density map beneath it. The businesses that master this perspective – that think in terms of population concentrations rather than country checklists – will dominate Africa’s consumer economy over the coming decades.
The question isn’t which African countries to enter. It’s which density zones generate sufficient ROI to justify investment. The map provides the answer: follow the red zones, connect the corridors, and let geometry guide strategy. Everything else is commentary.
John Kourkoutas is business development expert that specializes in helping companies, export teams, and business leaders succeed in Africa’s dynamic and emerging markets.